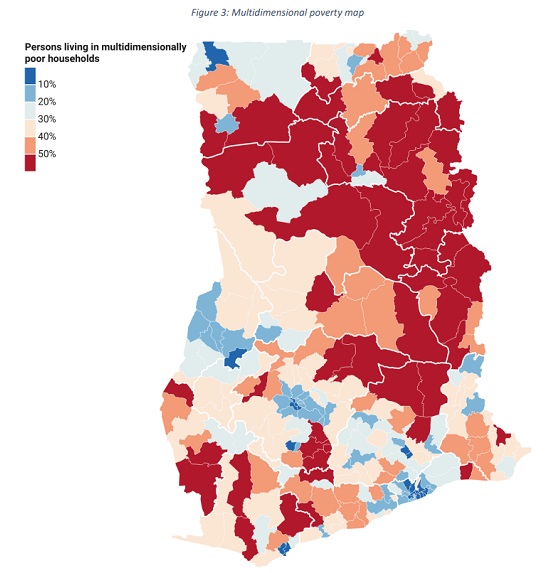
Accra – The Ghana Statistical Service (GSS) has recently published data revealing that more than half of the household population in 50 out of the 261 districts in Ghana (19.2%) are living in multidimensional poverty.
Among these districts, the Nkwanta North District in the Oti Region stands out with the highest poverty rate in the country, at a staggering 79.7%. This rate is more than twice the national average of 29.9%. Joining Nkwanta North are North East Gonja in Savannah (77.7%) and Sekyere Afram Plains in Ashanti (75.3%) as the only districts where over three-quarters of the households are living in poverty.
Of the top 10 districts with the highest poverty rates, three are located in the Northern Region, while the North East and Oti regions each have two districts included in the list. Notably, the Nanumba North municipality (114,226) and Gusheigu municipality (103,852) in the Northern Region are the only districts with more than 100,000 individuals residing in multidimensionally poor households.
Multidimensional poverty is measured by assessing deprivation across various domains, including living conditions (such as access to electricity, housing, assets, overcrowding, cooking fuel, water, and toilet facilities), education (school attendance, attainment, and lag), and health (insurance coverage and mortality).
Regarding the districts with the largest population living in poverty, four are located in the Northern Region, two in the Oti Region, and one each in Savannah, North East, Western, and Volta. Conversely, the New Juaben South Municipal in the Eastern Region has the lowest poverty rate in the country, standing at 4.8%. Additionally, it is one of the 21 districts where the multidimensional poverty rate is below 10%.
It is worth noting that six out of the 10 districts with the lowest poverty rates are situated in Greater Accra.
These statistics, which highlight the extent of multidimensional poverty in various districts, were released by the Ghana Statistical Service as part of the observance of the International Day for the Eradication of Poverty. This year's theme is “Dignity for All in Practice.”
Multidimensional Poverty in Ghana
The table below presents data on the multidimensional poverty of the household population in Ghana;
| Rank | Region | District | Percent of persons living in multidimensionally poor households | Number of persons living in multidimensionally poor households |
|---|---|---|---|---|
| 1 | Oti | Nkwanta North | 80% | 99,825 |
| 2 | Savannah | North East Gonja | 77.40% | 30,482 |
| 3 | Ashanti | Sekyere Afram Plains | 75.30% | 24,553 |
| 4 | Oti | Krachi NChumuru | 73.30% | 56,372 |
| 5 | Northern | Won | 72.40% | 68,663 |
| 6 | North East | Chereponi | 70.20% | 60,691 |
| 7 | Northern | Kpandai | 71.80% | 89,986 |
| 8 | Northern | Tatale Sanguli | 69.90% | 51,846 |
| 9 | North East | Mamprugu Moagduri | 72.20% | 49,372 |
| 10 | Bono East | Sene East | 69.50% | 49,756 |
| 11 | Savannah | North Gonja | 71.60% | 43,686 |
| 12 | Savannah | Central Gonja | 68.40% | 97,293 |
| 13 | North East | Yunyoo Nasuan | 68.60% | 39,019 |
| 14 | Upper West | Wa West | 66.30% | 63,846 |
| 15 | Northern | Nanumba South | 66.70% | 70,555 |
| 16 | Northern | Tolon | 67.80% | 78,453 |
| 17 | Savannah | Sawla Tuna Kalba | 66.00% | 73,595 |
| 18 | Northern | Gushegu Municipal | 67.70% | 103,852 |
| 19 | Eastern | Kwahu Afram Plains North | 64.60% | 42,449 |
| 20 | Oti | Nkwanta South Municipal | 63.40% | 85,079 |
Multidimensional Poverty Map of Ghana

Top and bottom 5 most multidimensionally poor districts in Ghana
Here is the region, district, and percentage of multidimensionally poor households in the top 5 poorest and top 5 richest districts in Ghana;
| Rank | Region | District | Percent of persons living in multidimensionally poor households | |
|---|---|---|---|---|
| 1 | Oti | Nkwanta North | 79.70% | |
| 2 | Savannah | North East Gonja | 77.40% | |
| 3 | Ashanti | Sekyere Afram Plains | 75.30% | |
| 4 | Oti | Krachi Nchumuru | 73.30% | |
| 5 | Northern | Mion | 72.40% | |
| Ghana | 29.9% | |||
| 257 | Greater Accra | Ga East Municipal | 7.40% | |
| 258 | Greater Accra | Ayawaso West Municipal | 7.30% | |
| 259 | Greater Accra | Terna West Municipal | 7.10% | |
| 260 | Ashanti | Asokwa Municipal | 5.20% | |
| 261 | Eastern | New Juaben South Municipal | 4.80% | |
Top 10 poorest districts in Ghana by population
The following table gives you a ranking of the top 10 districts in Ghana with the highest population of multidimensionally poor people;
| Rank | Region | District | Number of persons living in multidimensionally poor households |
|---|---|---|---|
| 1 | Northern | Nanumba North Municipal | 114,226 |
| 2 | Northern | Gushegu Municipal | 103,852 |
| 3 | Oti | Nkwanta North | 99,825 |
| 4 | Northern | Tamale Metropolitan Area | 97,591 |
| 5 | Savannah | Central Gonja | 97,293 |
| 6 | North East | East Mamprusi Municipal | 94,237 |
| 7 | Northern | Kpandai | 89,986 |
| 8 | Western | Prestea/Huni Valley Municipal | 88,009 |
| 9 | Oti | Nkwanta South Municipal | 85,079 |
| 10 | Volta | Ketu South Municipal | 81,129 |


